Trading analytics in plain numbers.
Start with the numbers anyone can read: P&L by day, win rate, streaks and what each mistake cost. Go deeper when you’re ready, with expectancy, R multiples, drawdown and how far each trade ran.
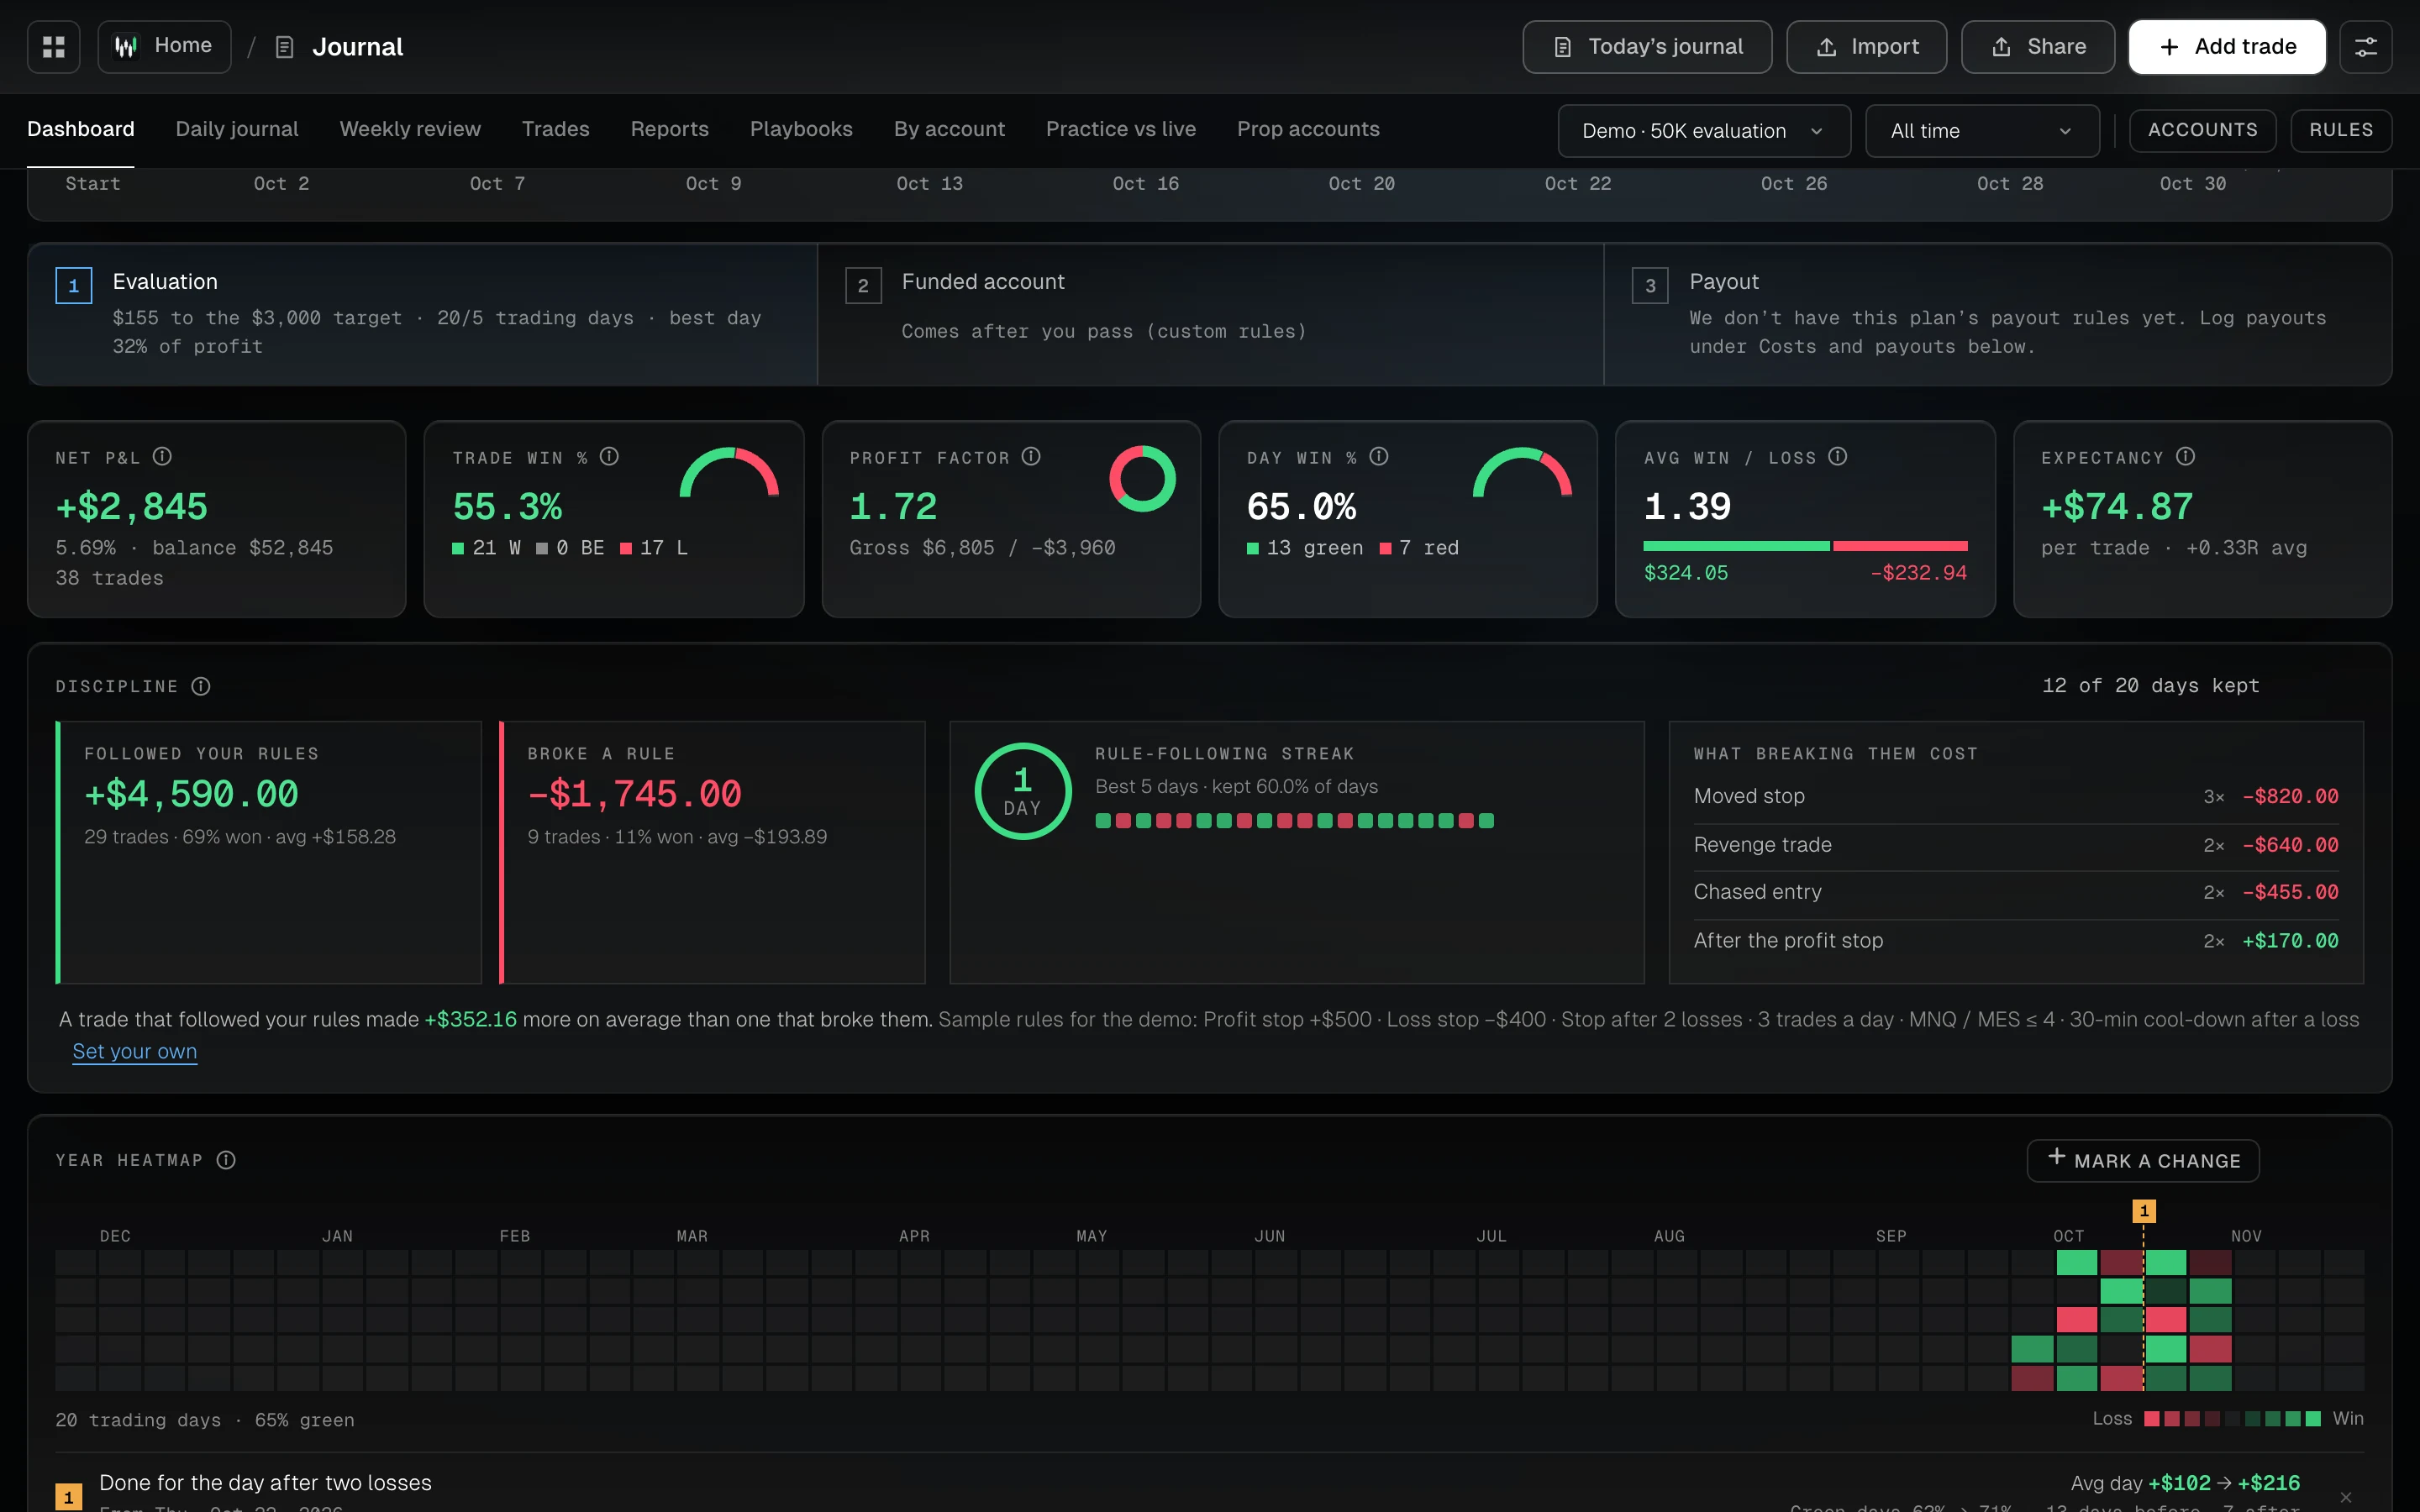
Wickform turns your journal into a dashboard: a P&L calendar and equity curve, a journal score from 0 to 100, streaks, and the dollar cost of each mistake. For a deeper look it has expectancy, R multiples, drawdown, Sharpe and Sortino, MAE / MFE, and results by session, hour, setup, grade and emotion.
- 0–100journal score, 7 parts
- 15breakdowns to filter by
- 1dashboard you can rearrange
Every trading day at a glance.
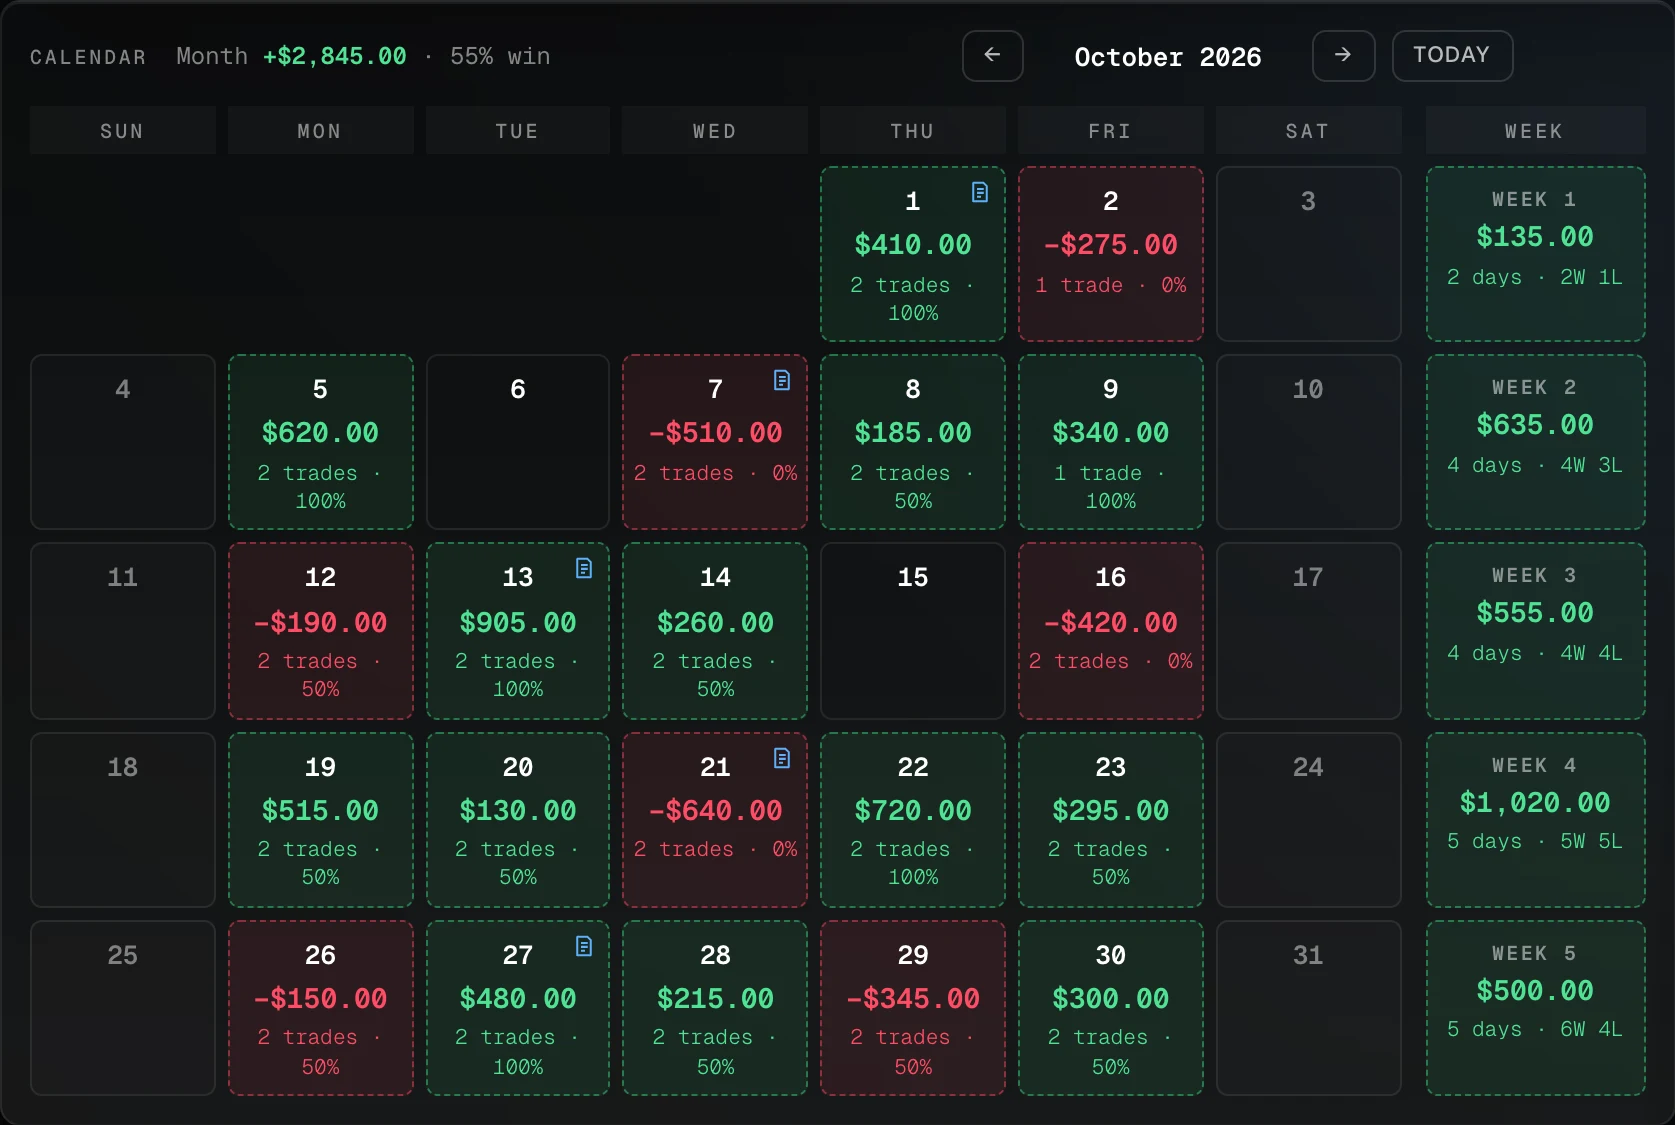
A P&L calendar with weekly totals, the equity curve, your win rate on trades and on days, and a journal score with a tip on every number. Drag the widgets into any order.
Green and red days, with weekly totals
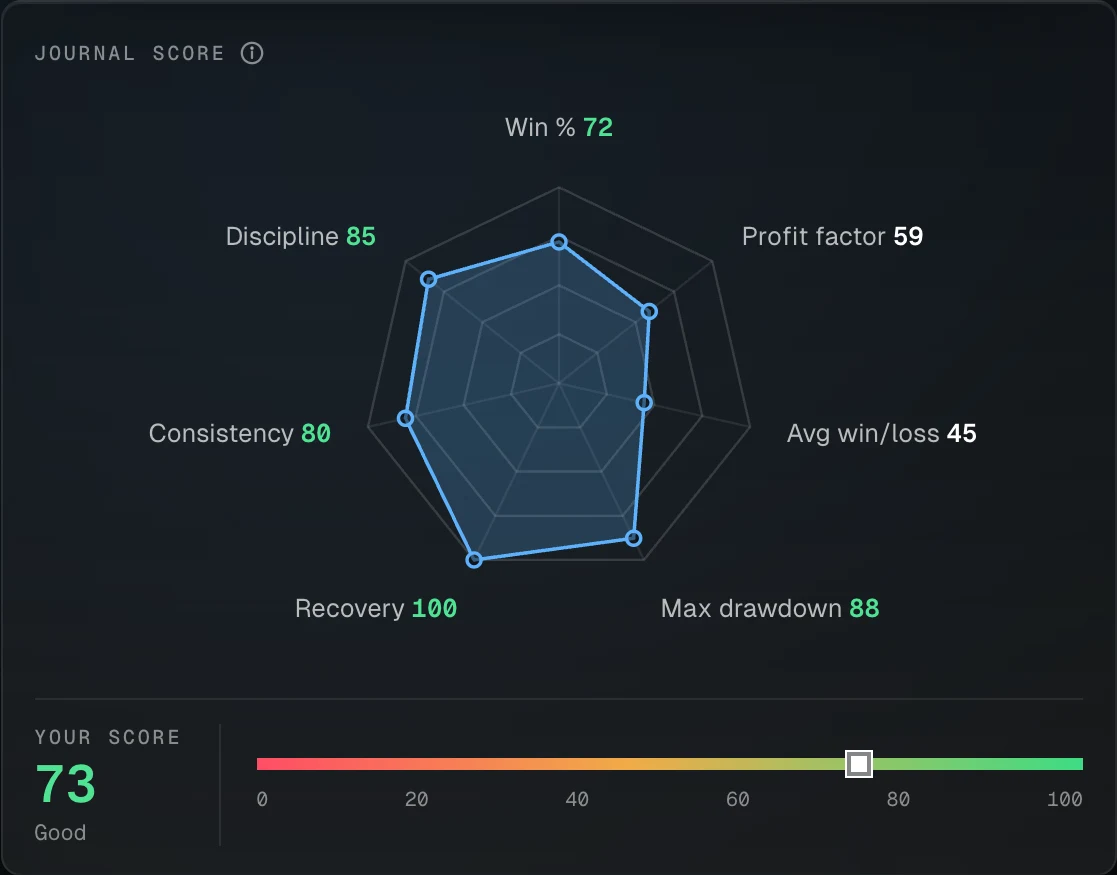
One number from 0 to 100
Seven weighted parts: win rate, profit factor, average win against loss, max drawdown, recovery, consistency and discipline.
A year of days, and what a change did
Mark the day you changed a habit, such as no trades after two losses, and compare your average day before and after.

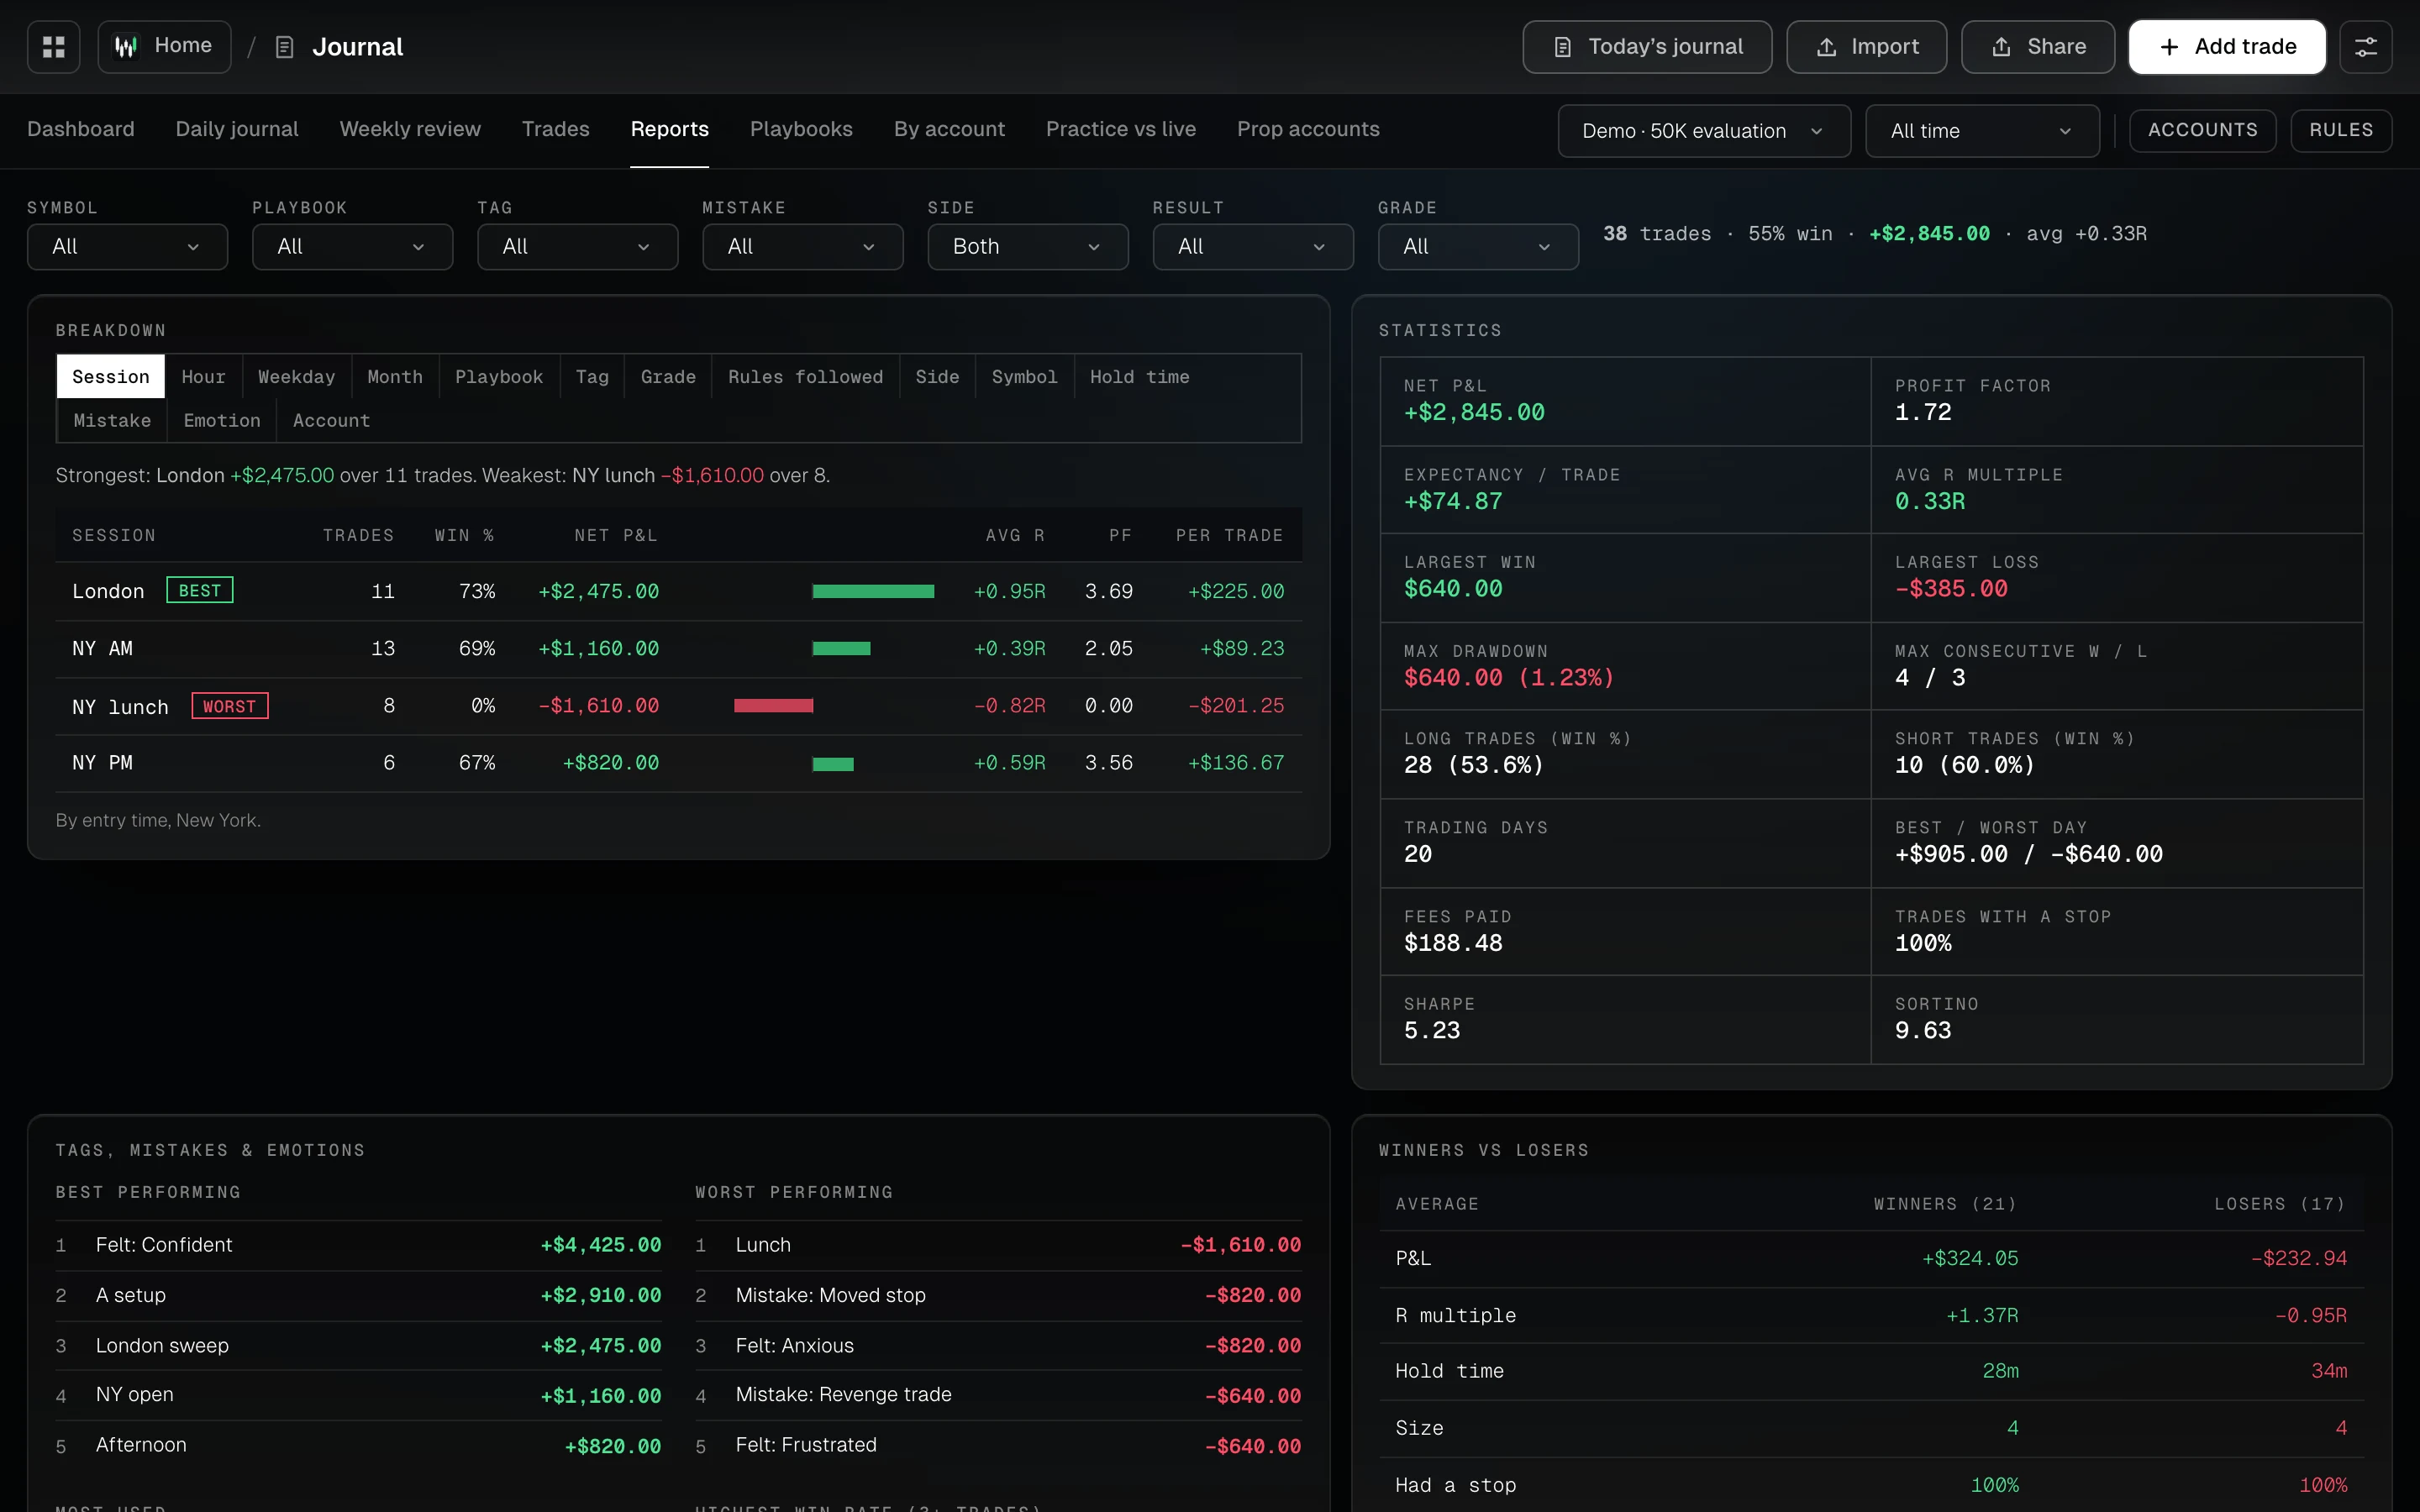
Find the session where your edge lives.
Results by session, hour, weekday, month, playbook, tag, grade, rules followed, mistake, emotion, hold time, side, symbol and account. Filter by any of them.
London made it. New York lunch gave it back.
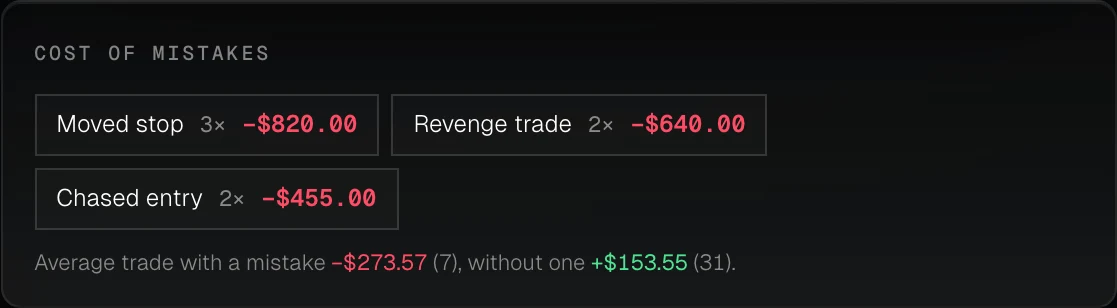
What each mistake cost, in dollars
Tag a mistake once and Wickform keeps count: how often it happens, what the trades it was on lost, and your average trade with a mistake against one without.
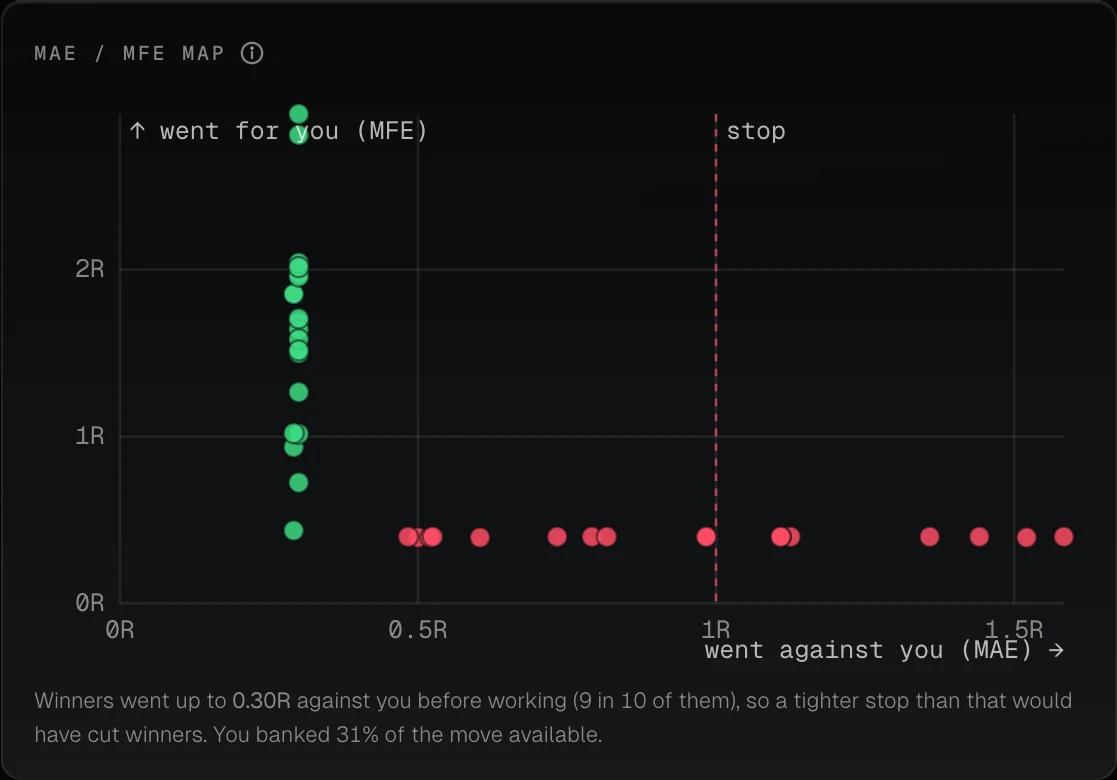
How far each trade ran for and against you
Measure your edge like a fund would.
The advanced widgets are one click away on the dashboard, and practice trades from replay sit next to your live ones.
The shape of your results
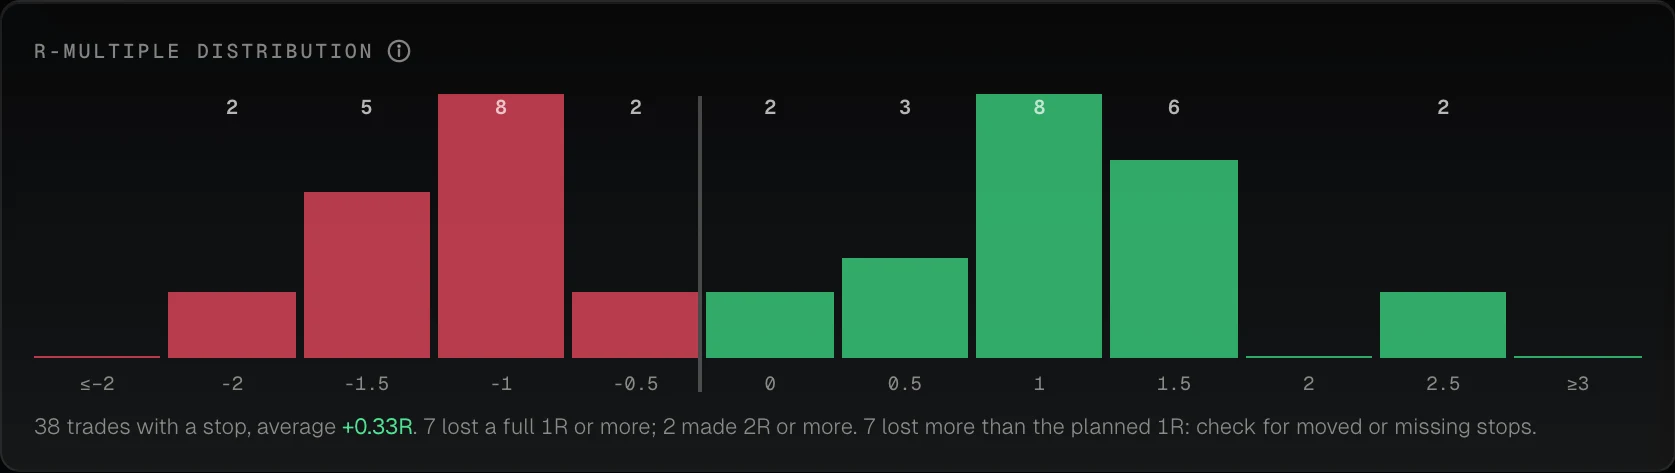
The numbers a fund would ask for
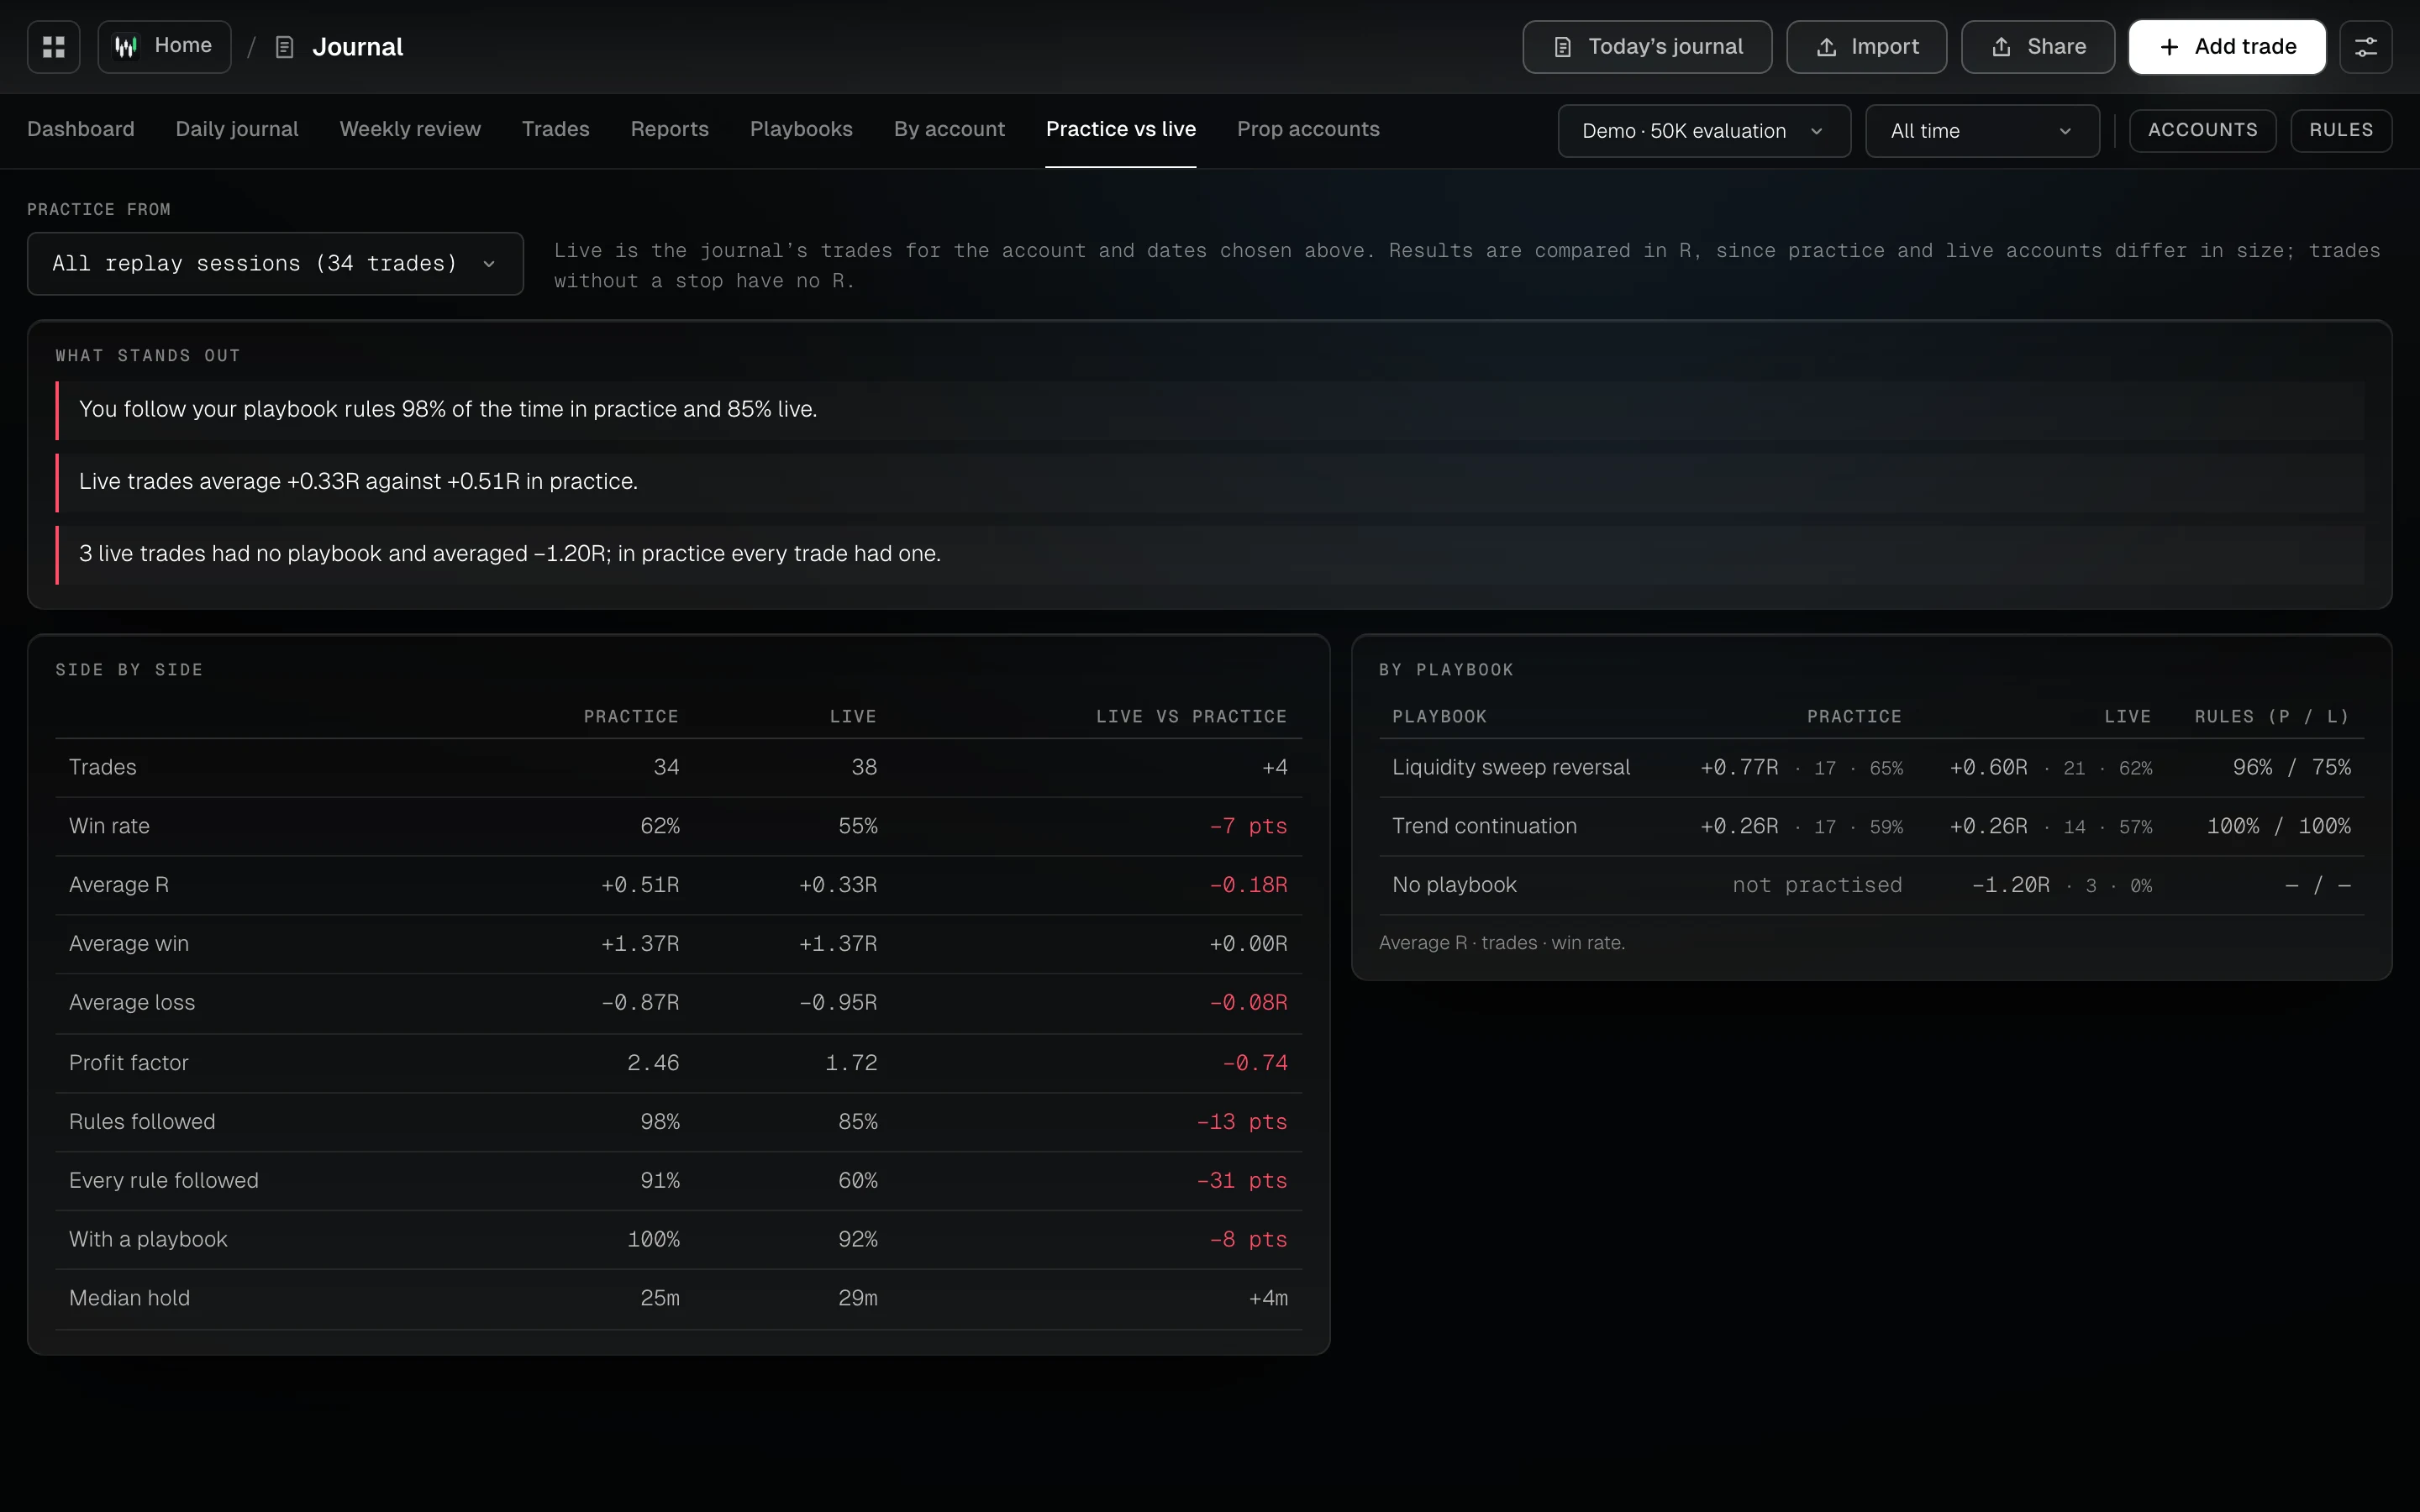
Is replay how you really trade?
Win rate, average R, rules followed and hold time in practice against live, overall and by playbook.
Three steps to start.
Import your trades
Every number is worked out from the trades in your journal, by account and date range.
Read the dashboard
The calendar, equity curve, win rate on trades and days, your streak and your journal score, each with a tip.
Find the leak
Break results down by session, hour, playbook, tag, mistake or emotion, and see what changed when you changed a habit.
Short answers, straight from the app.
Which trading stats matter most?
Expectancy, win rate with the average win and loss beside it, drawdown, and the cost of each repeated mistake. A high win rate with a small average win can still lose money.
What is a journal score?
One number from 0 to 100 for how healthy your trading is, from seven weighted parts. Each part has its own score and a tip, so you can see which one pulls the total down. It needs at least 5 trades.
How do I find where my edge is?
Filter results by session, hour, playbook, grade and more. A setup that makes money in London and loses it at New York lunch shows as two rows, not one average. See Read your results.
Guides, tools and terms that go with it.
Good to know.
What analytics does Wickform show?
A P&L calendar with weekly totals, the equity curve, win rate on trades and on days, streaks, what each mistake cost, a journal score, expectancy, R multiples, drawdown, recovery factor, Sharpe and Sortino, MAE / MFE, an R-multiple distribution, a weekday × hour heatmap and results by 15 breakdowns.
Can I see whether a change in my trading worked?
Yes. A year of trading days sits on one map. Mark the day you changed a habit and compare your average day before and after.
Can I compare my winners with my losers?
Yes. Winners and losers sit side by side: hold time, rules followed, grade, session and tags.
Can I rearrange the dashboard?
Yes. Drag widgets into any order, give one the full width, and add advanced ones like the R-multiple distribution or the MAE / MFE map.
Do the analytics include practice trades?
Practice trades from replay are kept apart from live ones, and you can put the two side by side.